The problem
Business users frequently receive CSV and Excel files but lack the time or analytical expertise to manually profile the data, explore dozens of field combinations, identify unusual behaviour and build an executive-ready report.
A self-service automated data intelligence product that turns CSV and Excel files into semantic profiles, ranked insights, visual discoveries, data-quality evidence and presentation-ready reports.
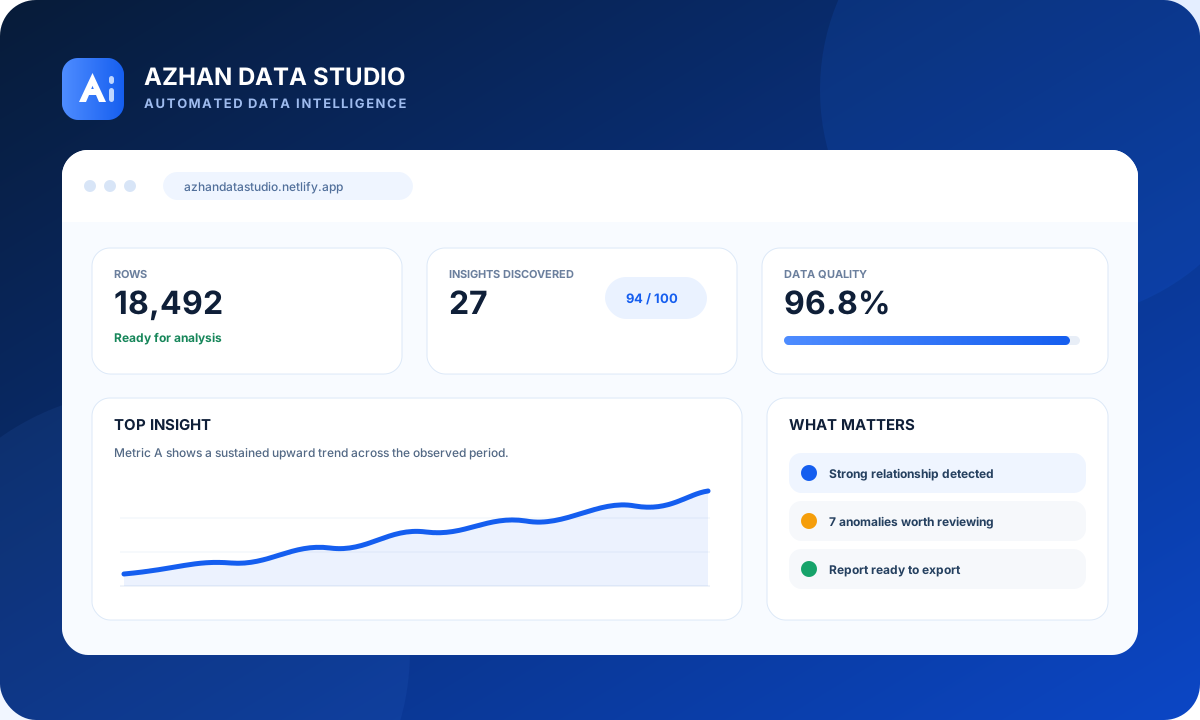
Traditional BI tools are powerful, but they usually require the user to know which fields matter, what questions to ask, which visual to choose and how to interpret the result. Azhan Data Studio was designed around a different starting point: “What should I know about this dataset?”
Business users frequently receive CSV and Excel files but lack the time or analytical expertise to manually profile the data, explore dozens of field combinations, identify unusual behaviour and build an executive-ready report.
Upload structured data once. The platform understands the fields, discovers statistically meaningful signals, ranks what deserves attention, chooses useful visuals and packages the results for sharing.
The analytics pipeline is deliberately separated into clear layers so every visible finding can be traced back to calculated evidence.
The platform is designed to work across structured datasets without assuming the file contains sales, HR, inventory, automotive or any other specific business domain.
Recognises identifiers, measures, categories, time fields, percentages, binary variables and free text.
Surfaces missing values, duplicates, completeness, unusual field behaviour and analysis readiness.
Analyses trends, correlations, group differences, outcome gaps, anomalies, concentration, skew and variability.
Prioritises the strongest signals instead of presenting every technically valid observation equally.
Automatically generates relevant trend, scatter, distribution, category, correlation and quality visuals.
Detects Excel worksheets, previews their shape and lets users choose the sheet they want to analyse.
Creates a branded analytical report with top findings, charts, quality evidence and an insight register.
Every finding carries calculated evidence so the user can see why the engine surfaced it.
Azhan Data Studio keeps the calculation layer deterministic. Python and Polars profile the data and run statistical discovery modules; the interface then presents those verified results through rankings, charts and reports.
The project combines front-end product design, backend API engineering and analytical computation rather than relying on a pre-built dashboard framework.
Azhan Data Studio is a portfolio project, but it is also a working public product that brings together several disciplines in one experience.
Upload a CSV or Excel workbook and see the analytics pipeline work on your own structured data.